2019年08月03日
国土地理院のバイナリベクトルタイルを OpenLayers で表示
2019年7月29日に国土地理院が提供実験を開始したバイナリ形式のベクトルタイル を JavaScript の地図ライブラリである OpenLayers で表示する方法です。
まずは 作成したデモ をどうぞ
ベクトルタイル概要
| 項目 | 説明 |
|---|---|
| URL | https://cyberjapandata.gsi.go.jp/xyz/experimental_bvmap/{z}/{x}/{y}.pbf |
| データソース | 数値地図(国土基本情報)- 地図情報等 |
| ズームレベル | 5~17 |
| 提供範囲 | 20万分1地勢図「宇都宮」「水戸」「甲府」「東京」「千葉」の範囲(縮尺によっては、その周辺も提供) |
| 提供開始 | 令和元年7月29日 |
従来のベクトルタイルは GeoJSON 形式でしたが、今回新たに提供実験が始まったベクトルタイルはシリアライズされた pbf という形式のファイルです。
また公開に合わせて Mapbox GL JS ベースの 地理院地図Vector の試験公開も始まりました。
開発環境
Webpack + TypeScript 環境を想定しています。
$ mkdir ol-vectortile
$ cd ol-vectortile
$ yarn init -y
$ yarn add --dev webpack webpack-cli webpack-dev-server
$ yarn add --dev css-loader style-loader
$ yarn add ol
// TypeScript を使う場合
$ yarn add --dev typescript ts-loader
$ yarn add @types/ol
バージョン
- ol@5.3.3
ディレクトリ構成
.
├── dist
│   └── index.html
├── src
│   └── index.ts
├── .gitignore
├── .prettierrc
├── tsconfig.json
├── webpack.config.js
├── package.json
└── yarn.lock
バイナリベクトルタイル表示の最小限のコード
OpenLayers でバイナリベクトルタイルを表示する最小限のコードです。
./dist/index.html
<html lang="ja">
  <head>
    <meta charset="utf-8">
    <meta name="viewport" content="width=device-width, initial-scale=1">
    <title>OpenLayers Vector Tiles</title>
    <style>
      html, body {
        width: 100%;
        height: 100%;
        margin: 0;
        padding: 0;
      }
      .map {
        width: 100%;
        height: 100%;
        margin: 0;
        padding: 0;
      }
    </style>
  </head>
  <body>
    <div class="map" id="map">
    <script src="./bundle.js"></script>
  </body>
</html>
./src/index.ts
import Map from "ol/Map";
import View from "ol/View";
import VectorTileLayer from "ol/layer/VectorTile";
import VectorTileSource from "ol/source/VectorTile";
import MVTFormat from "ol/format/MVT";
import { fromLonLat } from "ol/proj";

import "ol/ol.css";

// ベクトルタイルの olレイヤを定義
const vt = new VectorTileLayer({
  source: new VectorTileSource({
    format: new MVTFormat(),
    url: "https://cyberjapandata.gsi.go.jp/xyz/experimental_bvmap/{z}/{x}/{y}.pbf",
    attributions: [
      '<a href="https://github.com/gsi-cyberjapan/gsimaps-vector-experiment" target="_blank" rel=”noopener noreferrer”>国土地理院</a>',
    ],
  }),
});

new Map({
  target: "map",
  view: new View({
    center: fromLonLat([140.46, 36.37]),
    zoom: 10,
  }),
  layers: [vt],
});
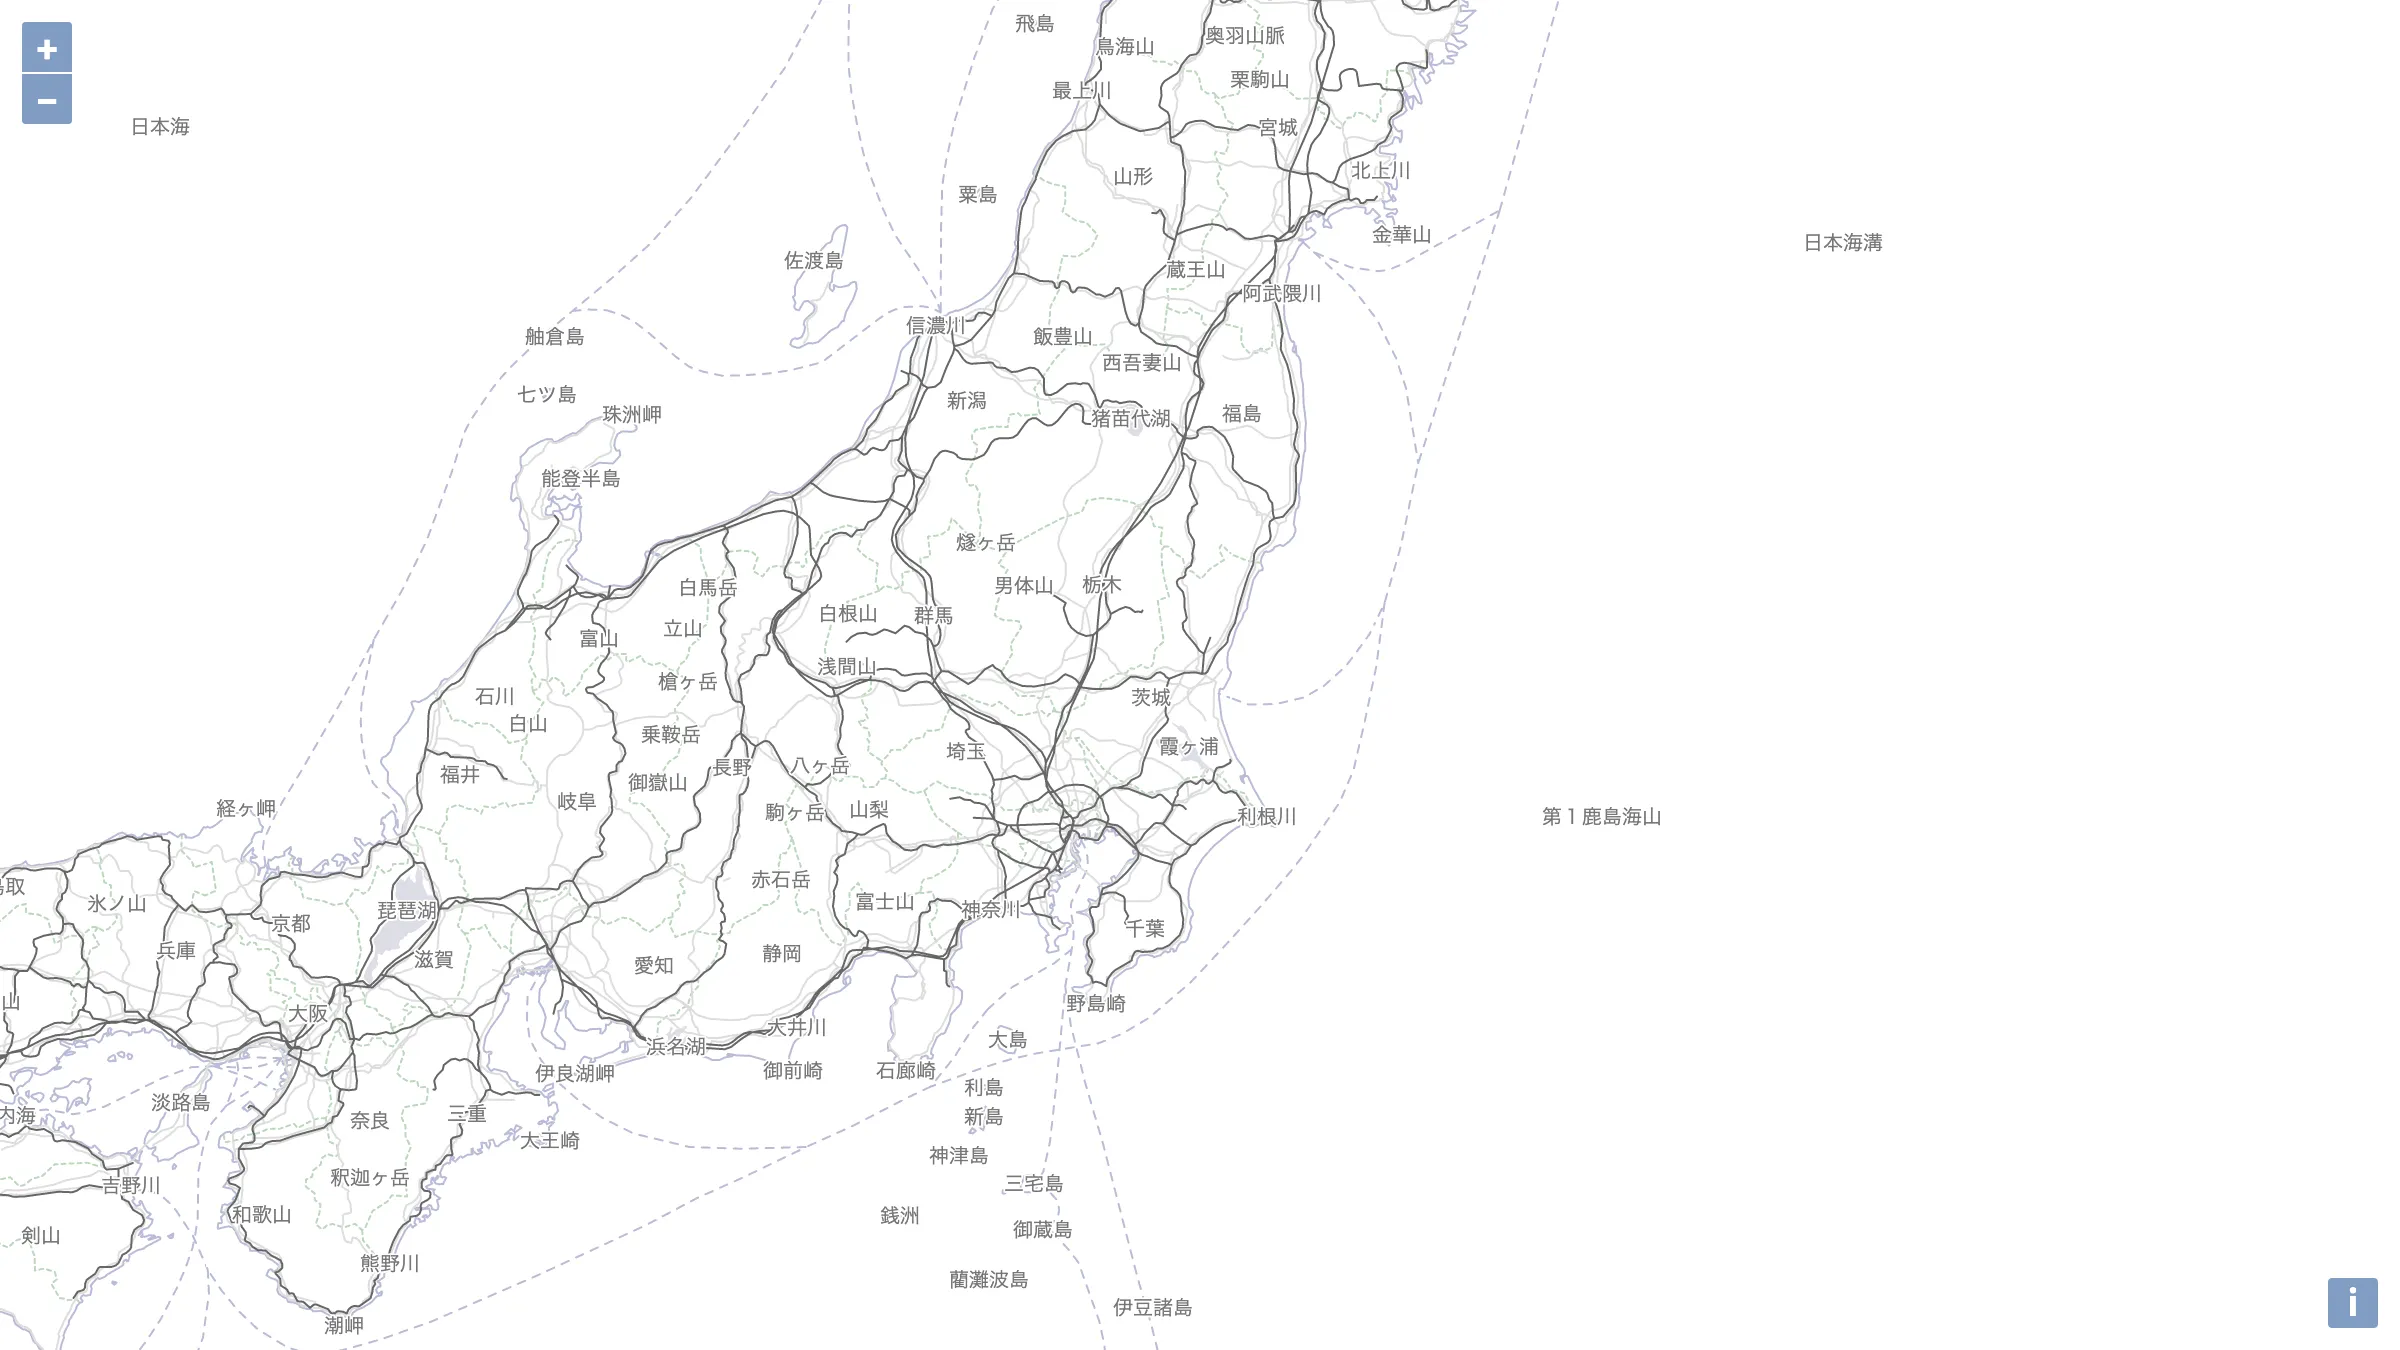
このコードで作成したデモは こちら です。
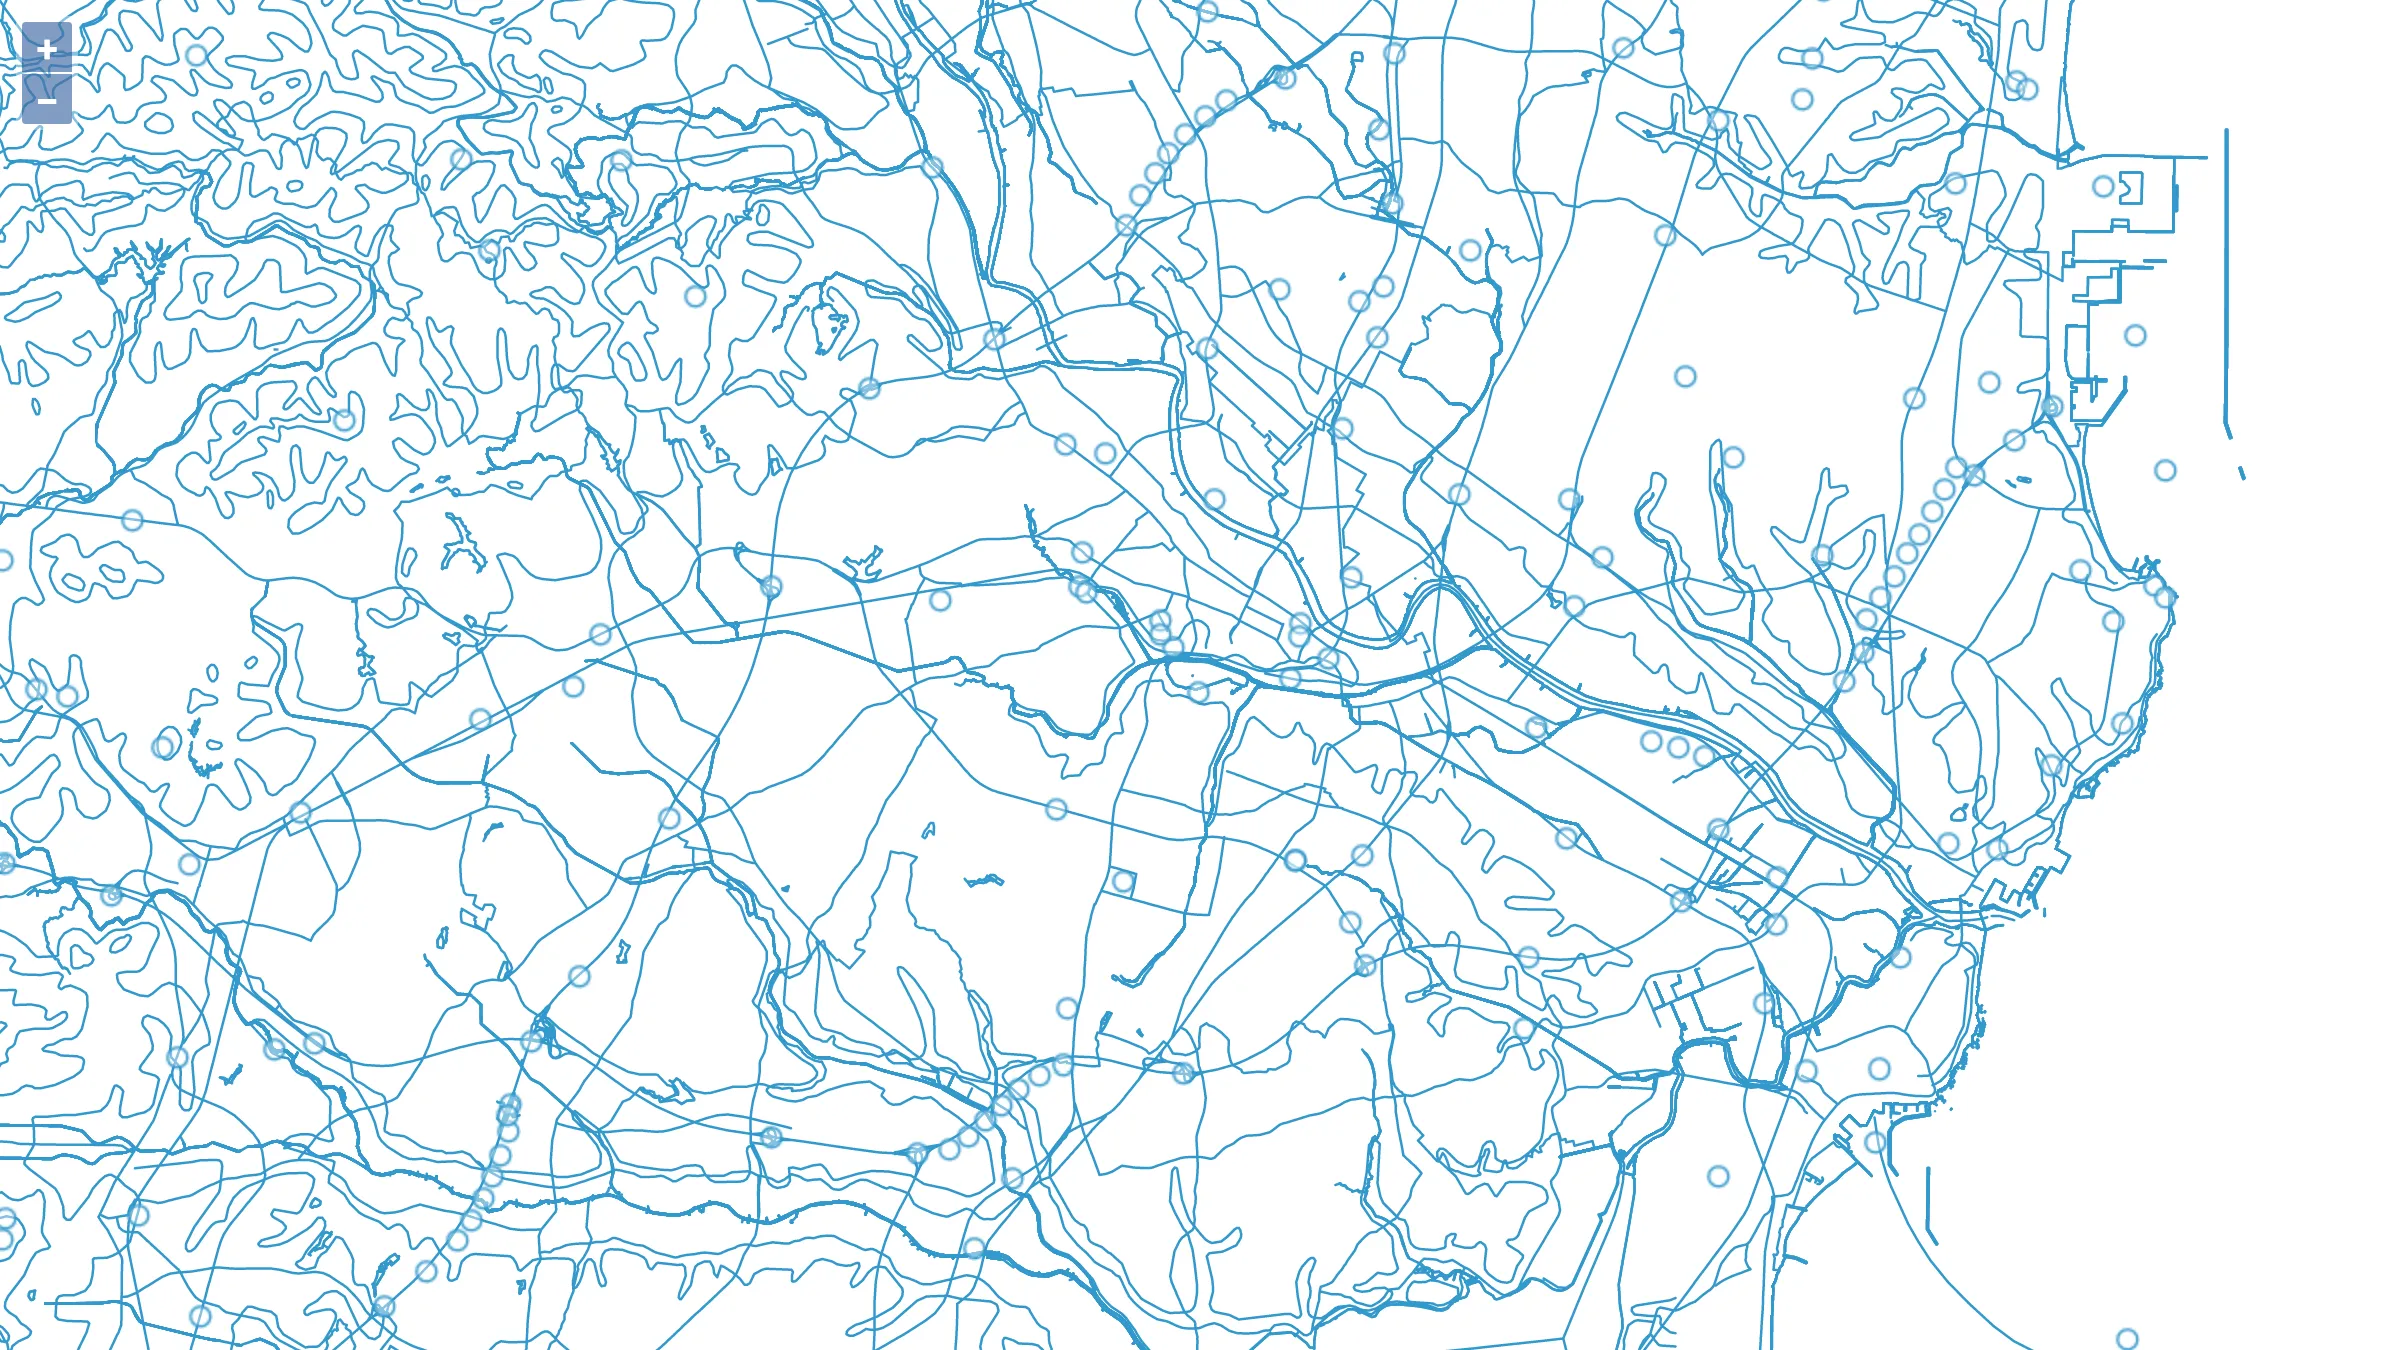
このデモではベクトルタイルの olレイヤ vt にスタイルを設定していないので、全ての地物にデフォルトのスタイルが適用されています。
さて、ここからはベクトルタイル内に含まれる地物のレイヤを扱いますが、これを OpenLayers のレイヤクラスと区別するため、OpenLayers のレイヤクラスを olレイヤ と表記します。
より地図らしくしていく
先ほどのコードで国土地理院のバイナリベクトルタイルを OpenLayers で表示することに成功しました。ここからは「レイヤの選択」と「スタイルの設定」で表示する地図を、より地図らしくしていく作業になります。
まずは src ディレクトリに layers ディレクトリと styles ディレクトリを作成し、src ディレクトリの構成を以下のように変更します。
src
├── index.ts
├── layers
│   └── vt.ts
└── styles
    └── vtstyle.ts
レイヤを選択して描写
バイナリベクトルタイルは、GeoJSON 形式のベクトルタイルとは違って、タイル内にレイヤ情報を含んでいます。全てのレイヤをスタイリングするのは非常に手間がかかるため、ここではレイヤの選択をおこないます。
レイヤの選択は、VectorTileSource オブジェクトの format プロパティに設定した MVTFormat オブジェクトを編集することで実現できます。layers プロパティに選択するレイヤ名の配列を設定します。
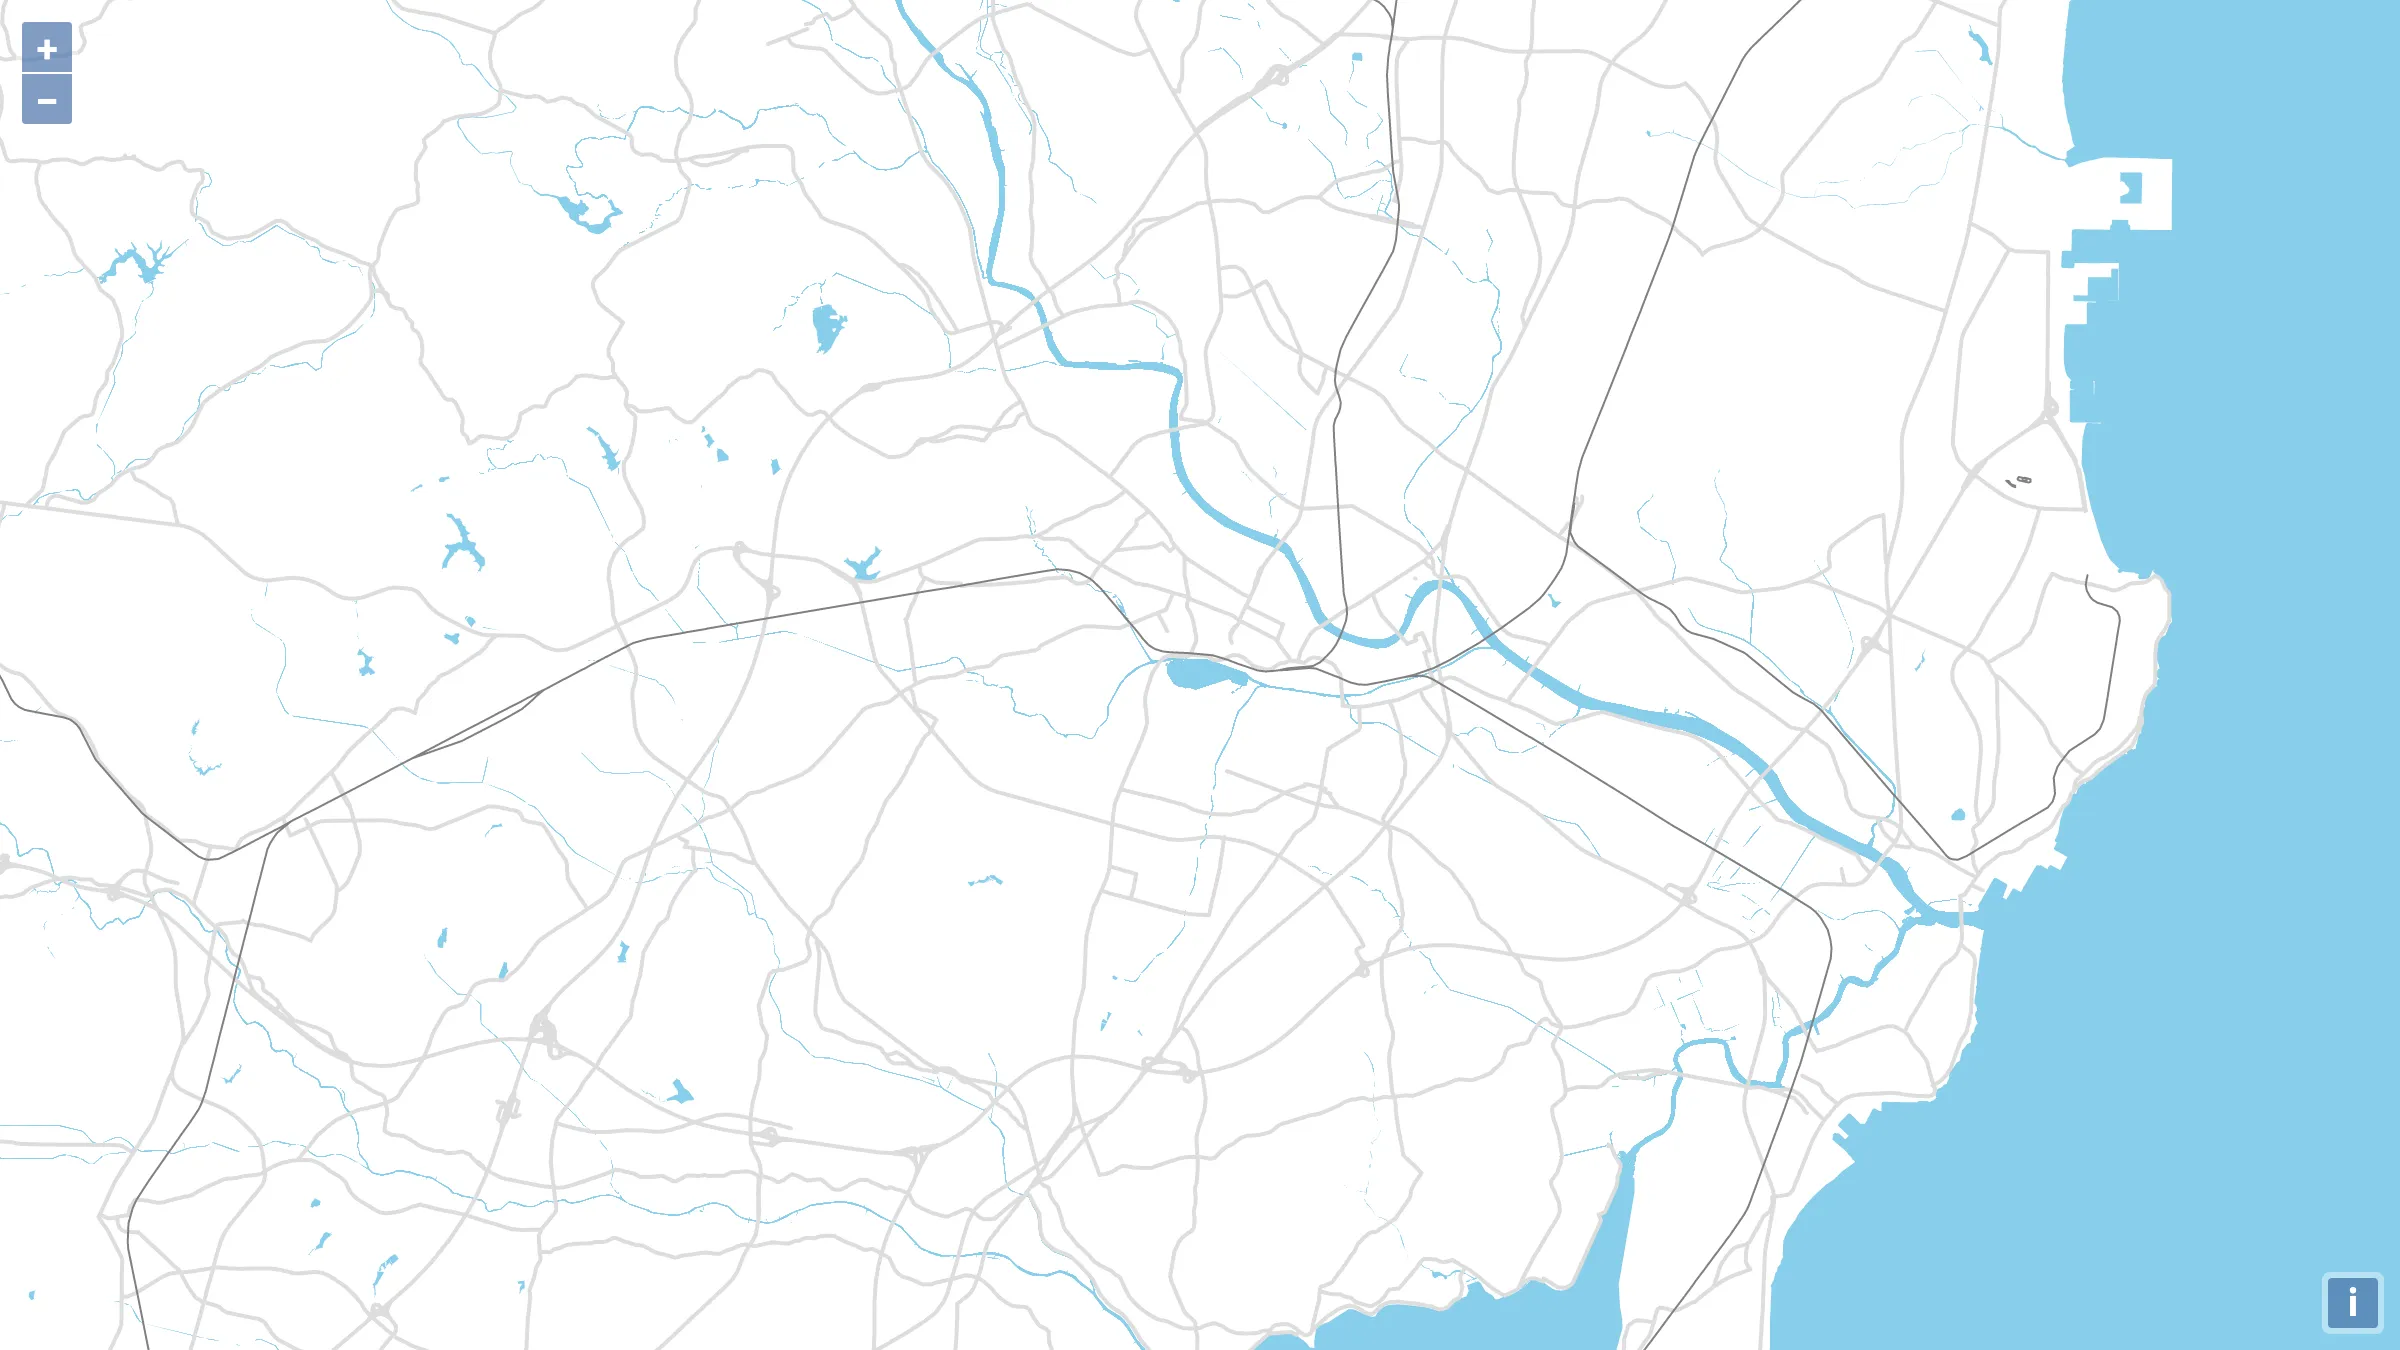
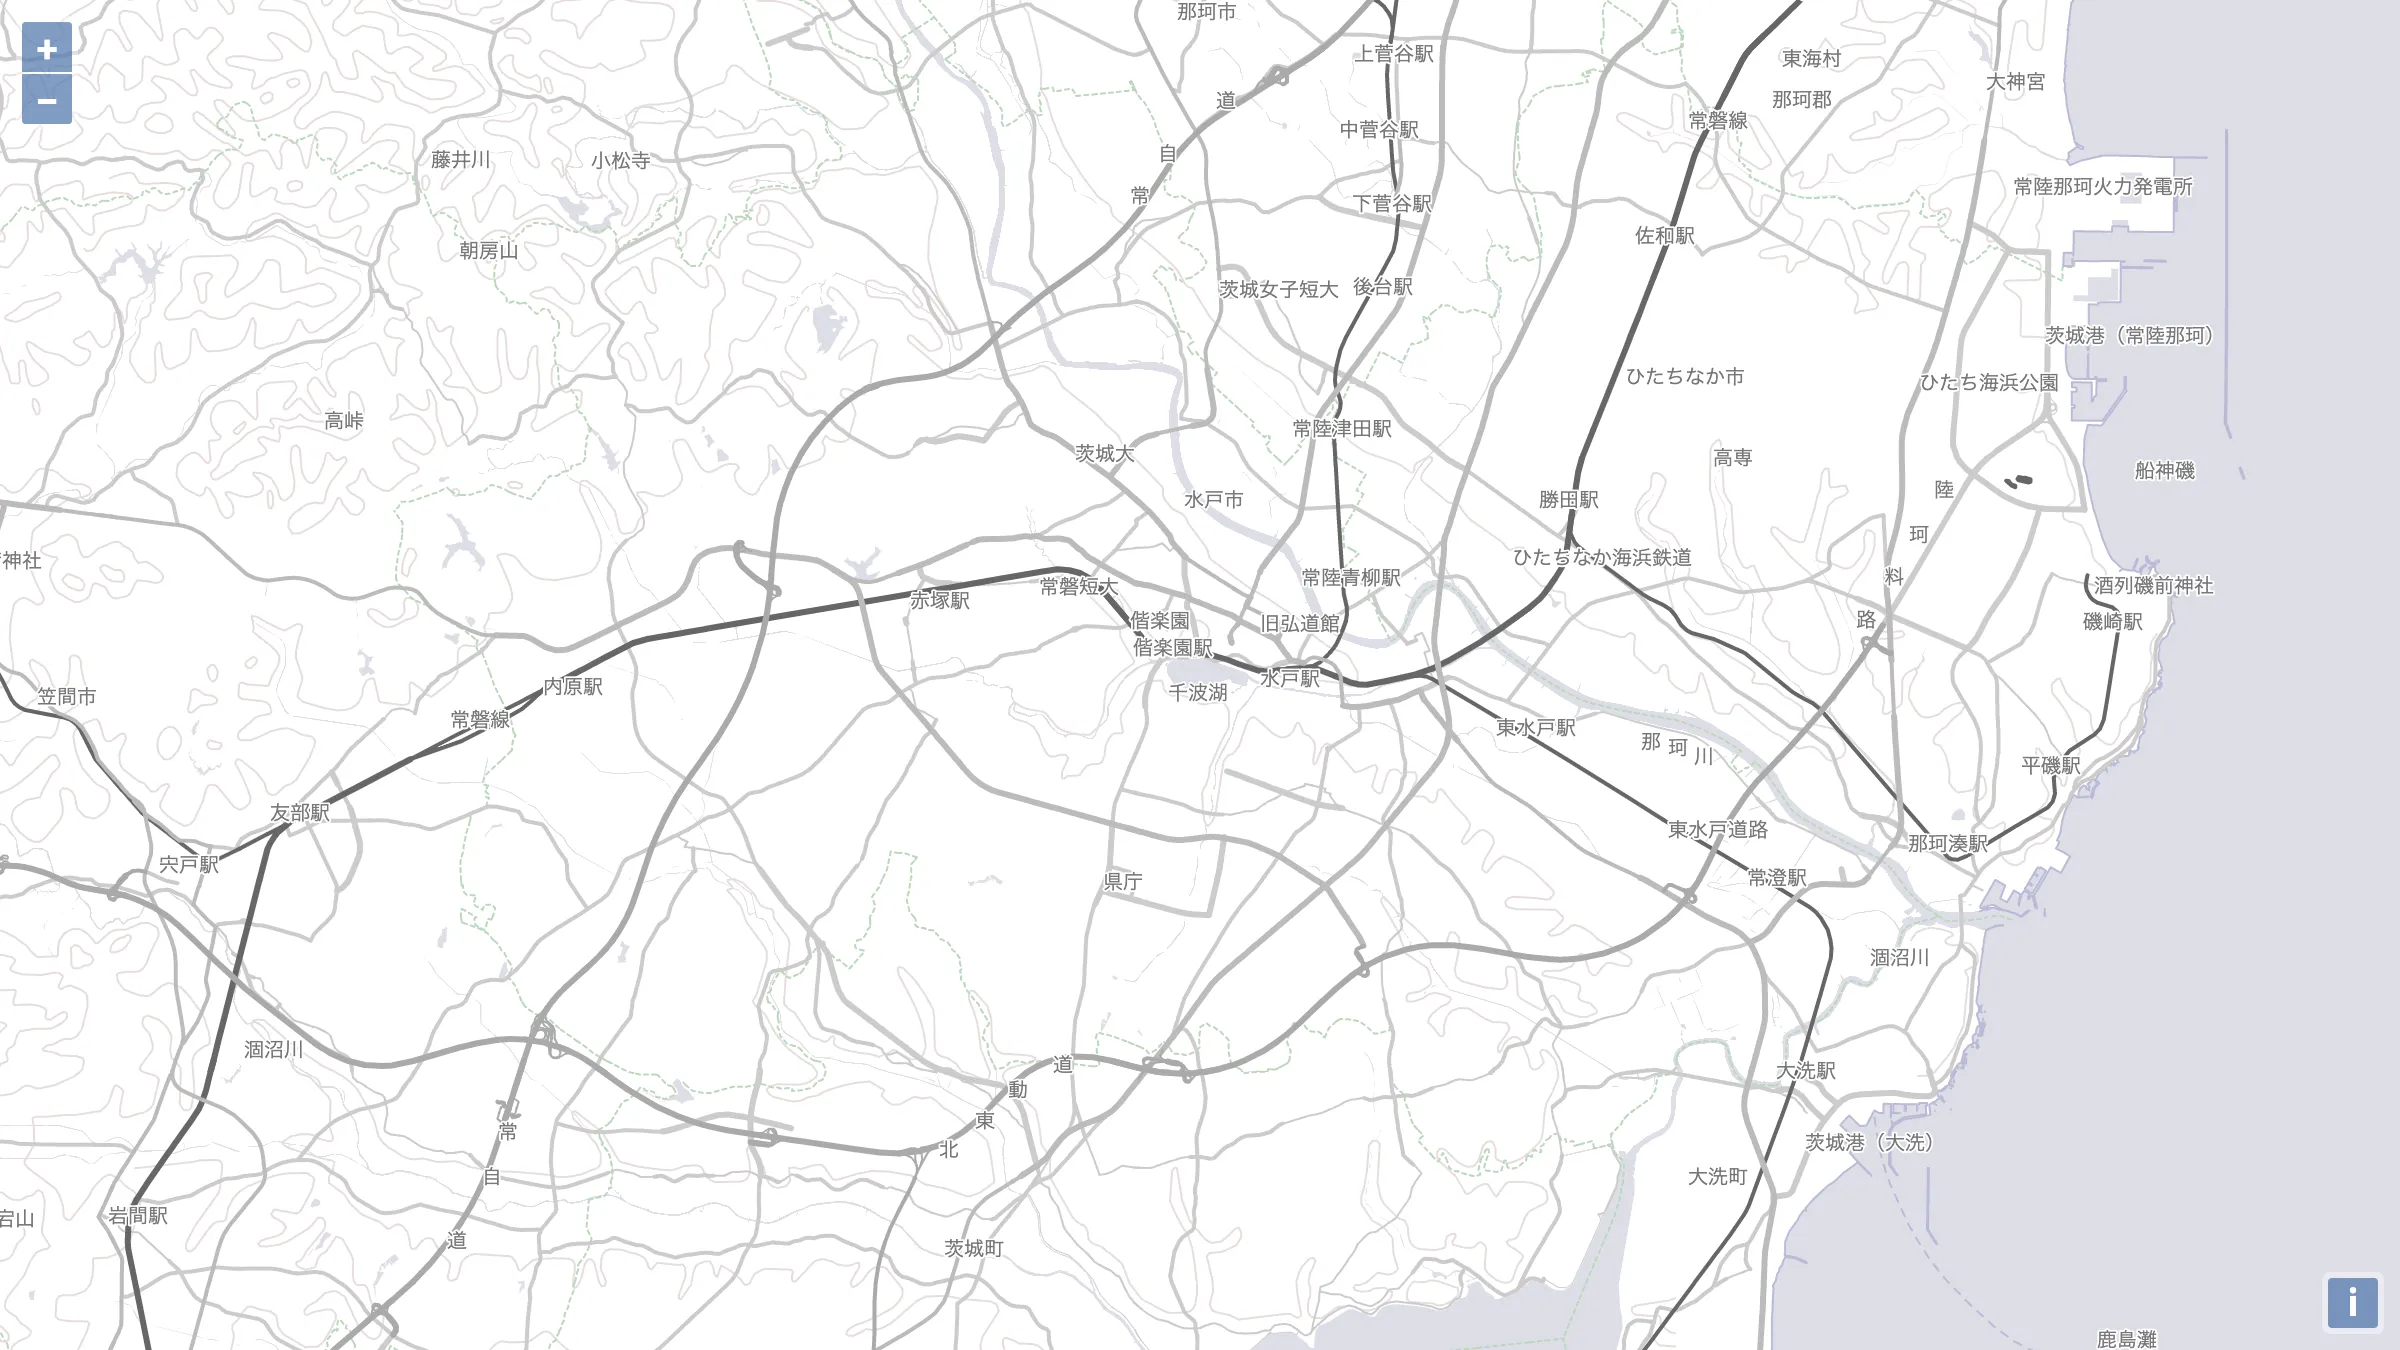
次の例では、道路(road)、鉄道(railway)、海岸線(coastline)、河川(river)、湖池(lake)、水域(waterarea) のみを選んで描写しています。
./src/layers/vt.ts
import VectorTileLayer from "ol/layer/VectorTile";
import VectorTileSource from "ol/source/VectorTile";
import MVTFormat from "ol/format/MVT";

// 次の項で作成する StyleFunction
import vtstyle from "../styles/vtstyle.ts";

const vt = new VectorTileLayer({
  source: new VectorTileSource({
    format: new MVTFormat({
      // 取得するレイヤ名を配列に記述する
      layers: ["river", "coastline", "lake", "waterarea", "road", "railway"],
    }),
    url: "https://cyberjapandata.gsi.go.jp/xyz/experimental_bvmap/{z}/{x}/{y}.pbf",
    attributions: [
      '<a href="https://github.com/gsi-cyberjapan/gsimaps-vector-experiment" target="_blank" rel=”noopener noreferrer”>国土地理院</a>',
    ],
  }),
  style: vtstyle,
});

export default vt;
レイヤを取捨選択することで、必要に応じた様々な地図を作成することができます。
レイヤの一覧は 地物コード及び表示ズームレベル一覧 で確認できます。
レイヤごとにスタイルを作成
olレイヤにスタイルを適用していきます。
olレイヤのスタイルの指定方法は以下の3通りです
Styleオブジェクトを指定StyleStyleオブジェクトの配列を指定Style[]StyleFunctionを指定(RenderFeature, number) => Style | Style[]
ここからは StyleFunction を作成してベクトルタイルのレイヤに合わせたスタイル指定の方法を行ないます。
StyleFunction は RenderFeature と resolution (number) を引数にとり、Style オブジェクトあるいは Style オブジェクトの配列を返します。
./src/styles/vtstyle.ts
import Style from "ol/style/Style";
import Stroke from "ol/style/Stroke";
import Fill from "ol/style/Fill";
import RenderFeature from "ol/render/Feature";

export default function vtStyle(feature: RenderFeature, resolution: number) {
  // RenderFeature から properties を取得
  const properties = feature.getProperties();
  // properties に格納されているレイヤ名からスタイルを書き分ける
  if (properties.layer === "road") {
    return new Style({
      stroke: new Stroke({
        color: "#ddd",
        width: 2,
      }),
      zIndex: 1,
    });
  } else if (properties.layer === "railway") {
    return new Style({
      stroke: new Stroke({
        color: "gray",
      }),
      zIndex: 2,
    });
  } else if (properties.layer === "coastline") {
    return new Style({
      stroke: new Stroke({
        color: "skyblue",
        width: 2,
      }),
      zIndex: 0,
    });
  } else if (
    properties.layer === "river" ||
    properties.layer === "lake" ||
    properties.layer === "waterarea"
  ) {
    return new Style({
      fill: new Fill({
        color: "skyblue",
      }),
      zIndex: 0,
    });
  } else {
    // 空の new Style() を返すと何も描写しない
    return new Style();
  }
}
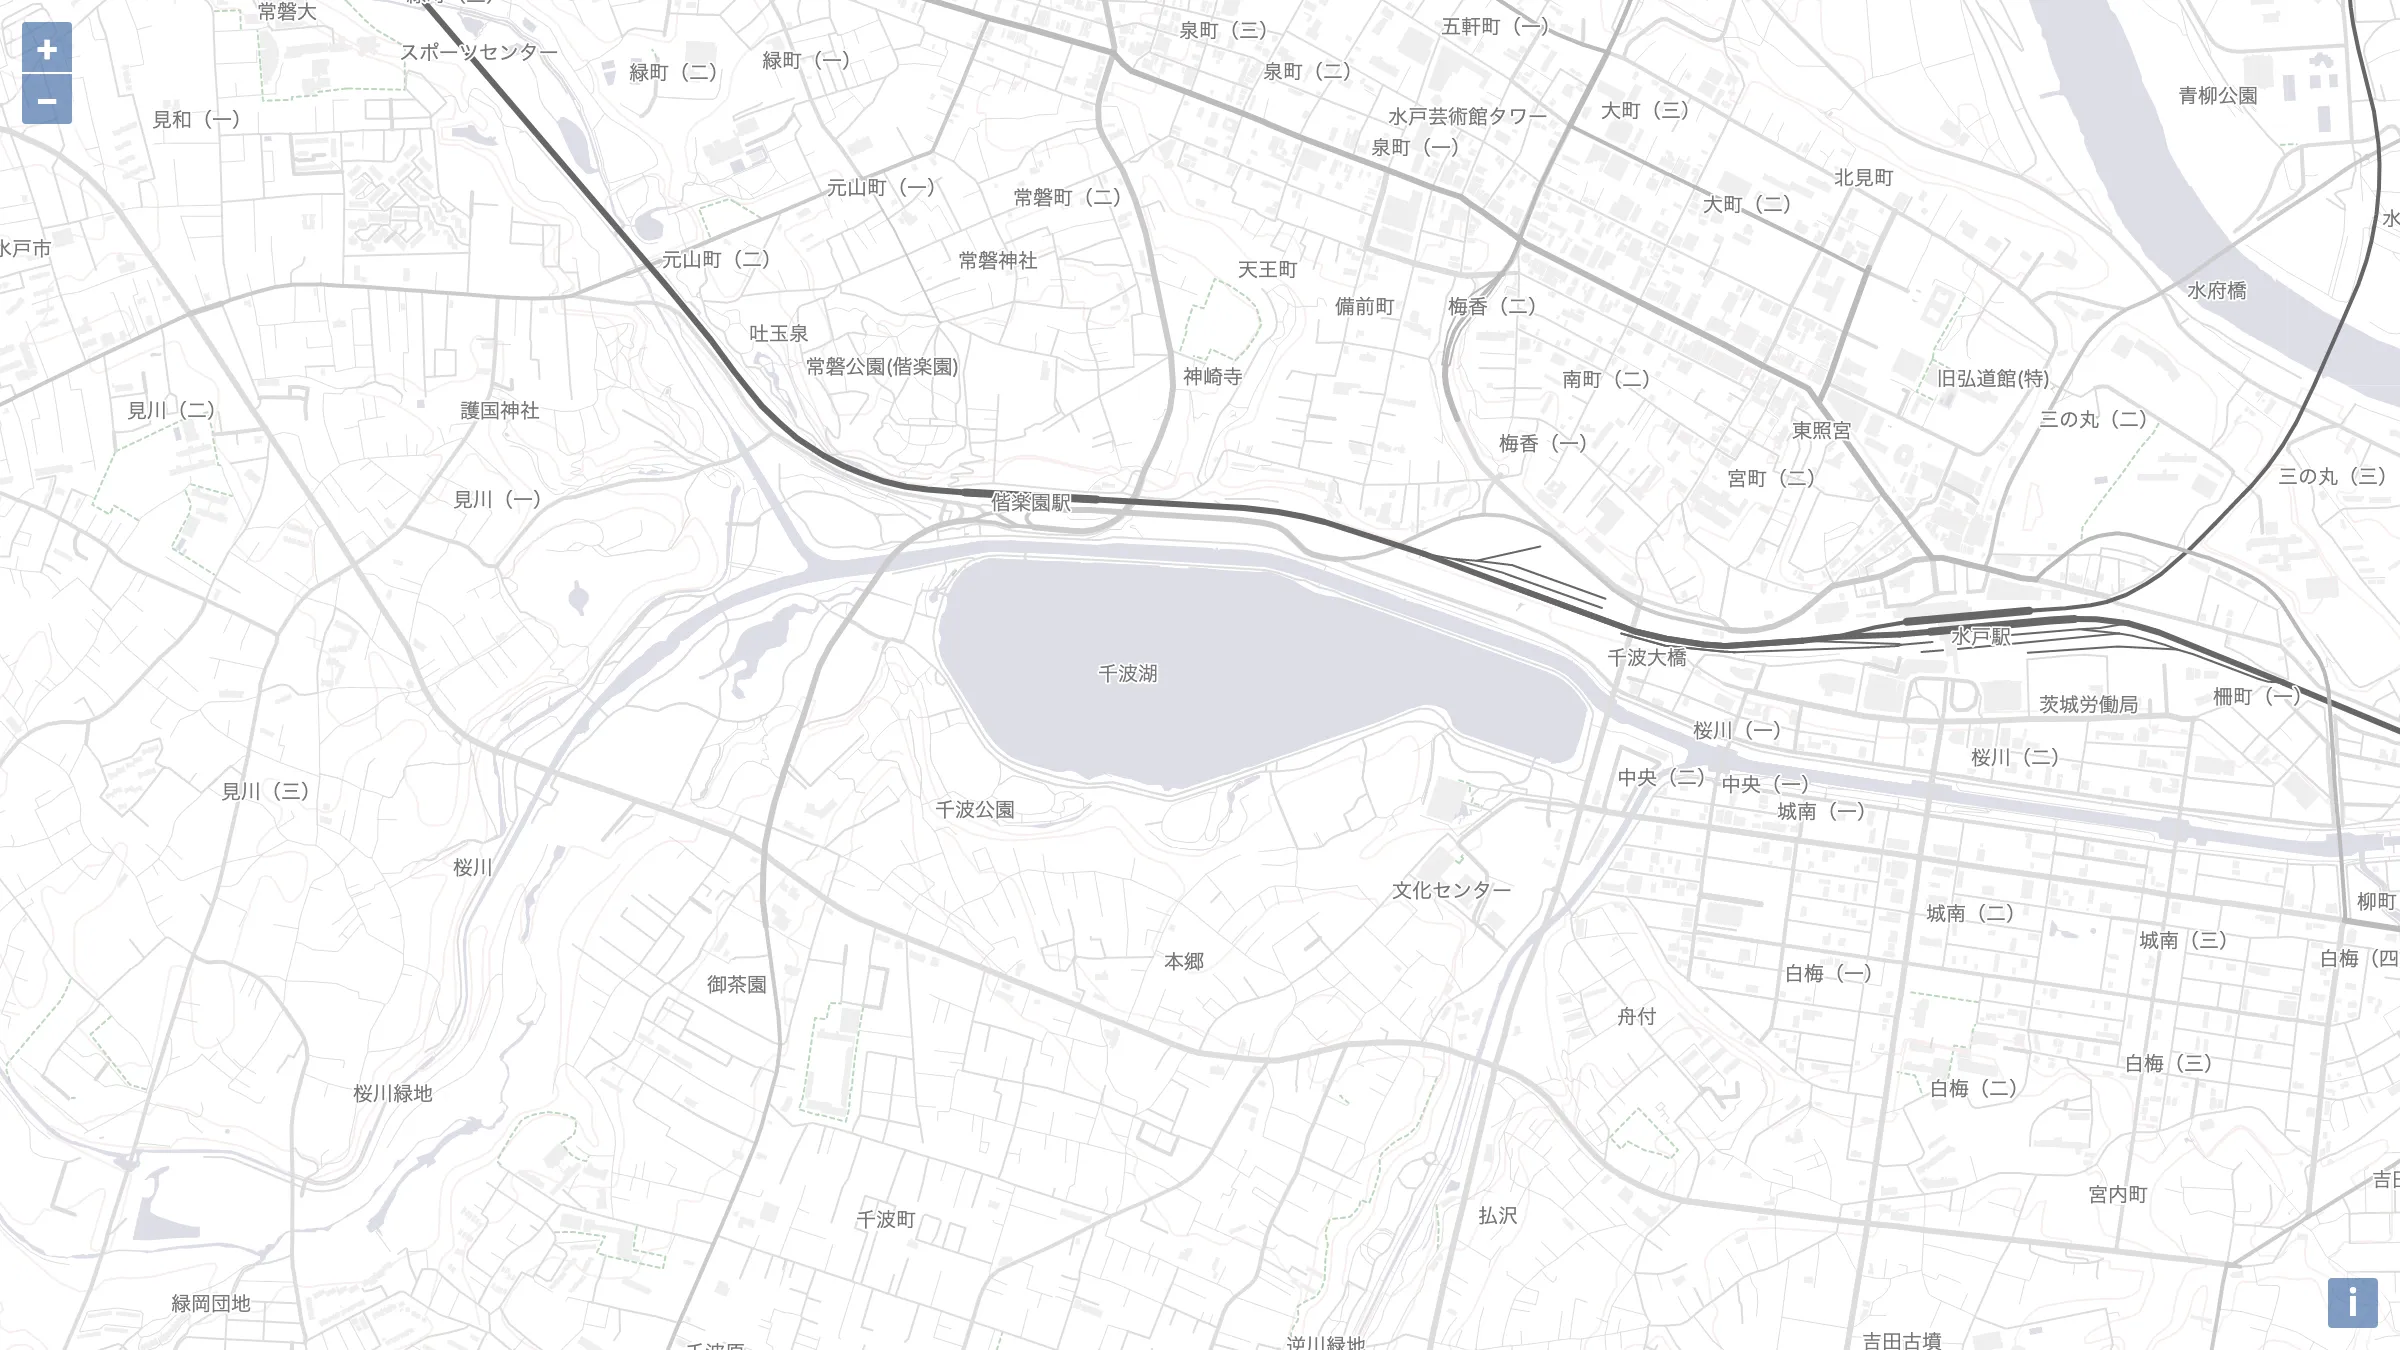
このスタイルで作成したのが デモ2 です。
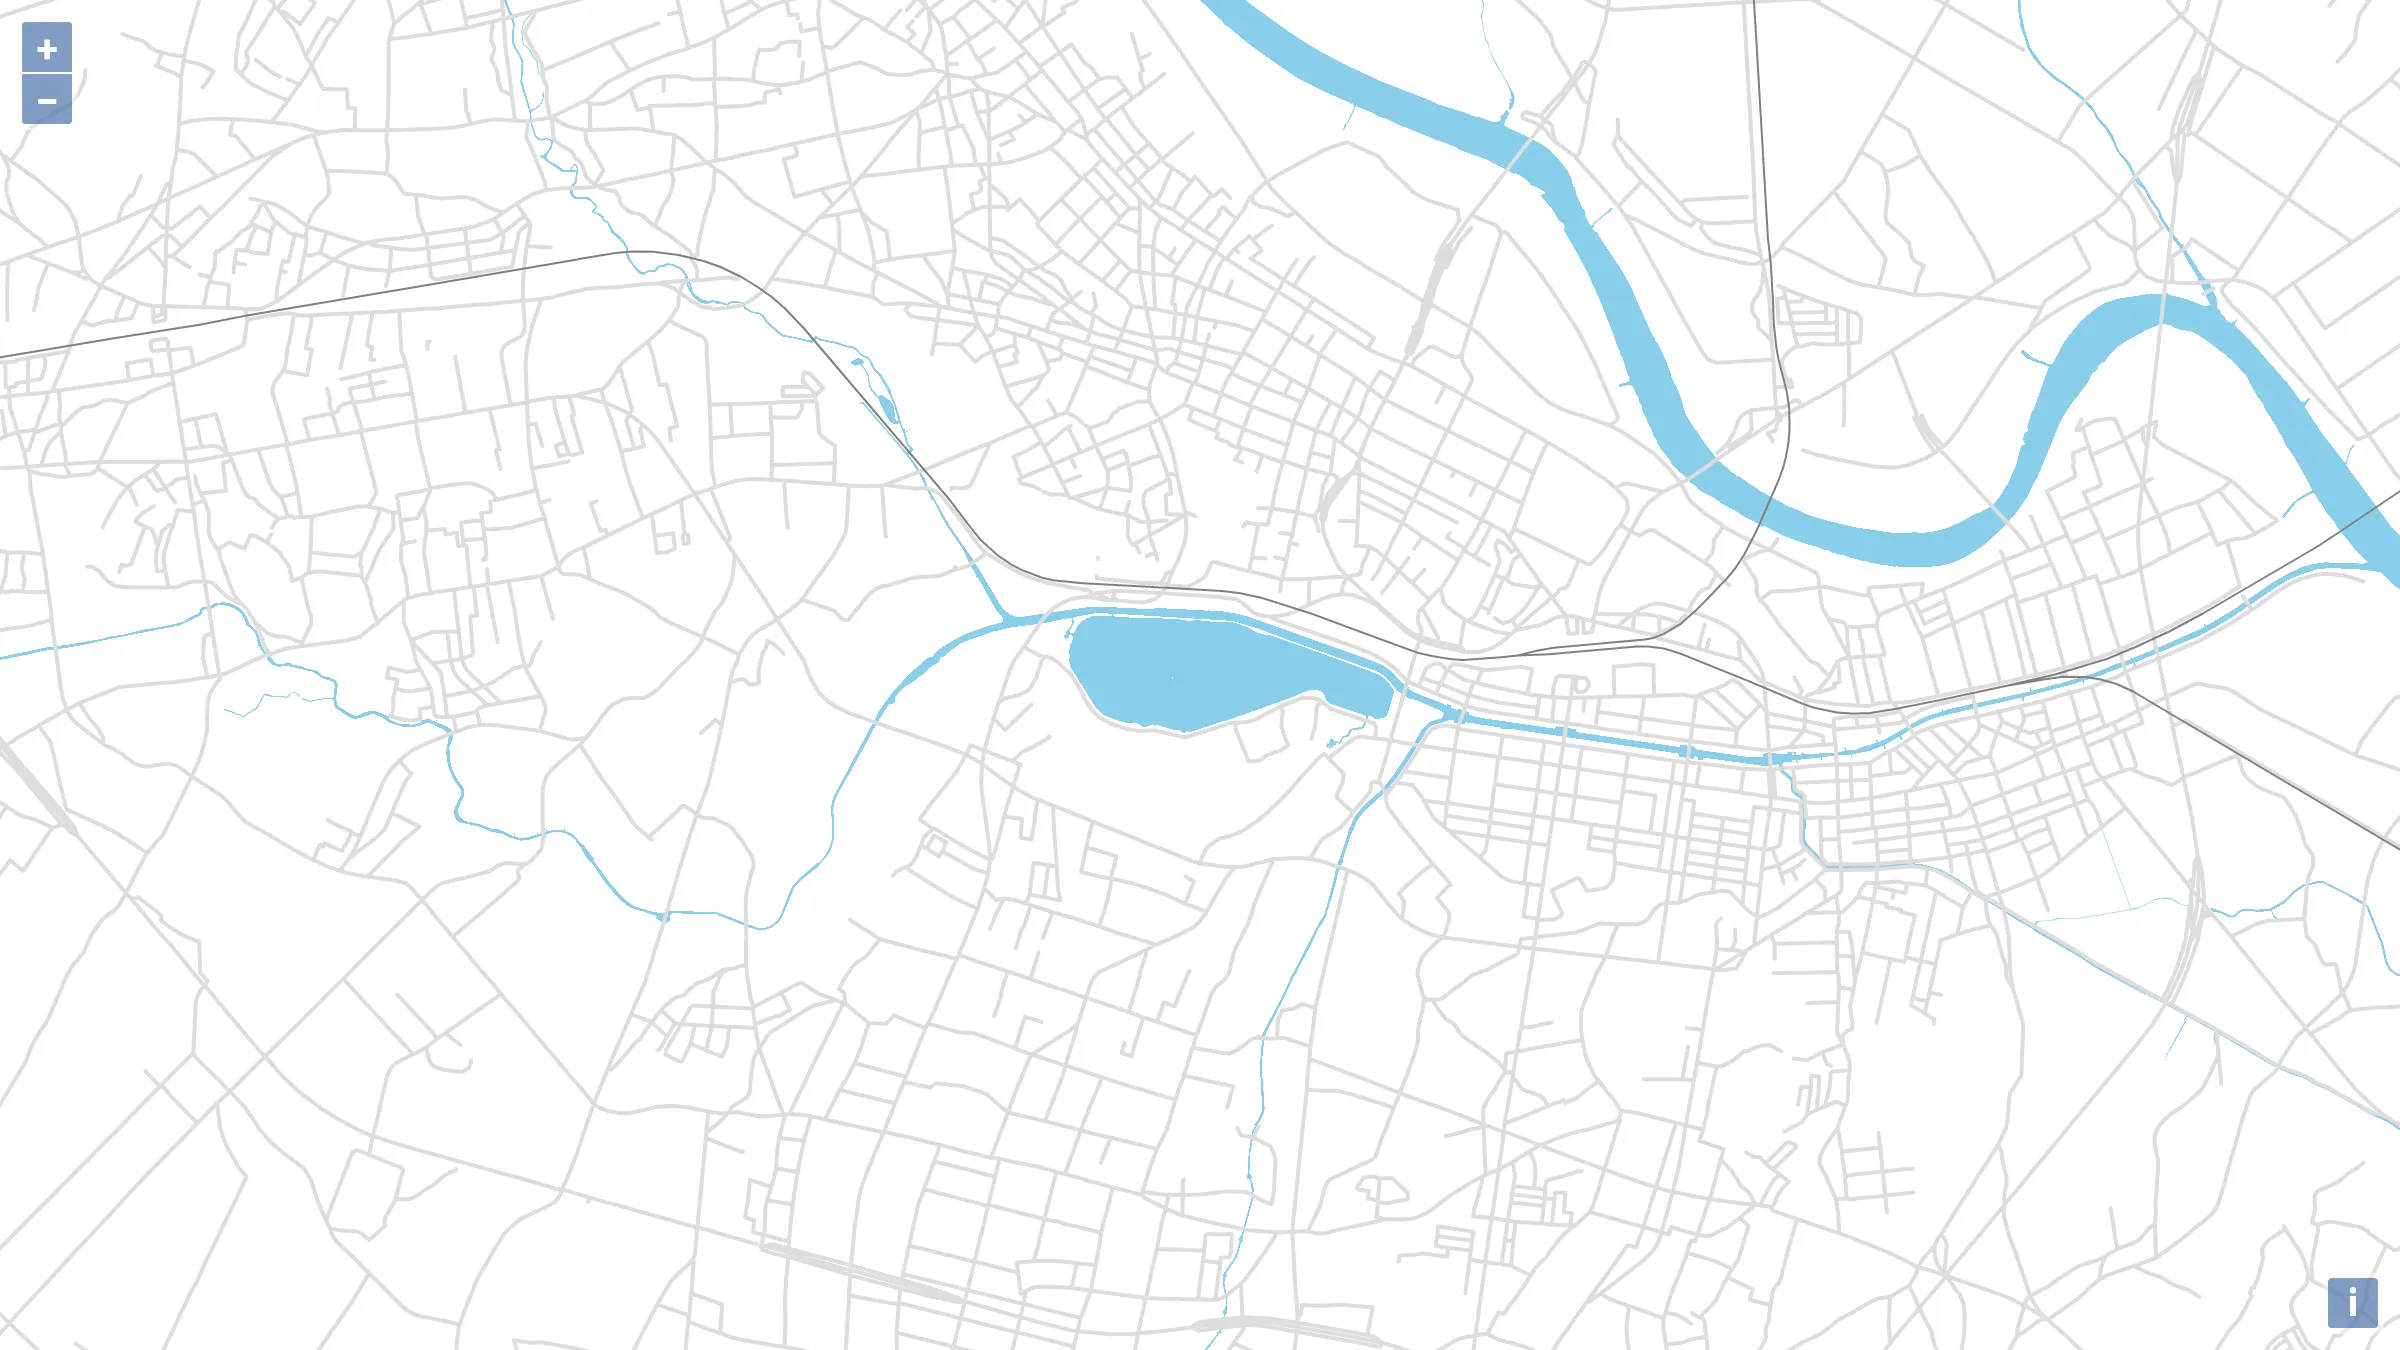
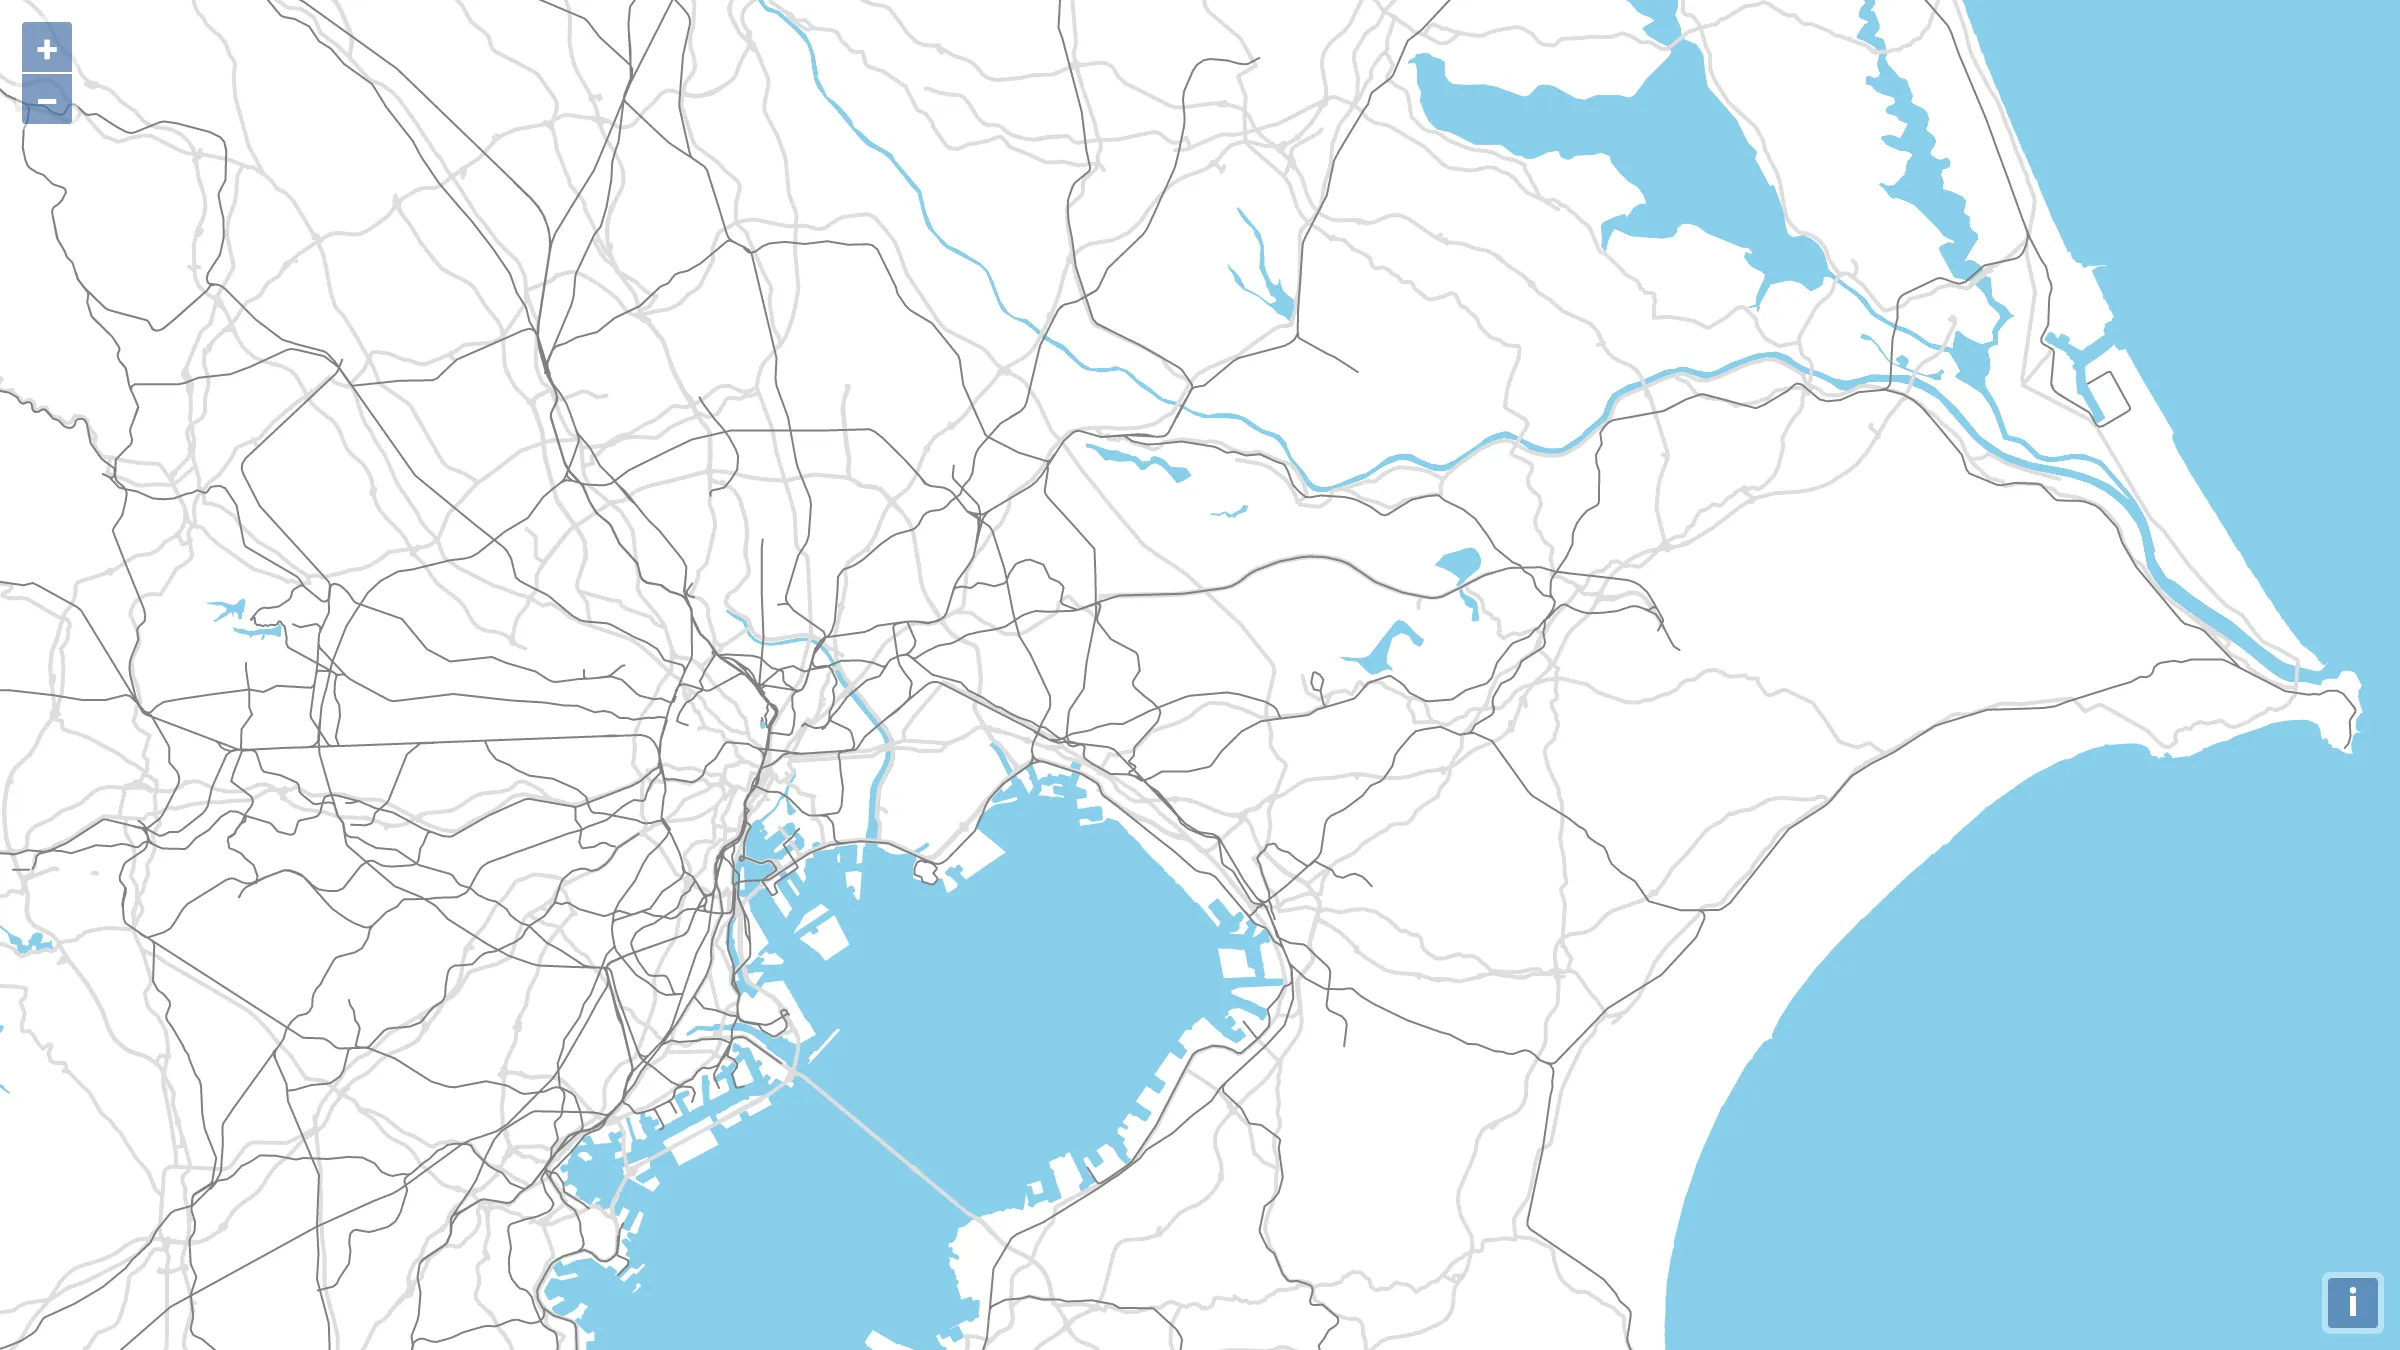
この例では、ベクトルタイル内のレイヤのみでスタイルを書き分けましたが、地物の属性(properties)から道路の区分や幅員を取得することで、さらに複雑なスタイリングを施すことができます。
地物コード及び表示ズームレベル一覧 と 地物の属性一覧 を読んで、どのようなレイヤ、属性があるか確認してください。
プロジェクト作成例
GitHub に OpenLayers + TypeScript プロジェクト作成例のリポジトリを作成しました。 このリポジトリを clone すれば、Webpack 周りの初期設定をせずに OpenLayers で国土地理院ベクトルタイルを使った開発が可能になります。
まとめ
以上、OpenLayers で国土地理院のバイナリベクトルタイルを使う上での基礎的な内容でした。
バイナリベクトルタイルの利用は、 Mapbox GL JS を使うのが一番良い方法だとは思いますが、バイナリベクトルタイルへの対応を見ると OpenLayers もまだまだ捨ててもんじゃないなと思いました。
今までは煩雑だと思っていた OpenLayers の書き方も、TypeScript や Dart といった静的型付け言語を勉強して、その理屈がよくわかりました。 今回初めて OpenLayers を TypeScript で書いてみたのですがやはり相性がよかったです。
リンク
- ベクトルタイルとその提供実験について 国土地理院
- 地理院地図Vector(仮称)提供実験のソース GitHub
- 地理院地図Vector
- 国土地理院ベクトルタイル + OpenLayers + TypeScript Example GitHub
- OpenLayers
エニウェア / ベランダ (2018)
地図
OpenLayersなどの地図に関するJavaScriptライブラリや、ベクトルタイルといった地図に関する技術情報です。